Lab 8
Introduction
The purpose behind this lab is to gain experience on the measurement and interpretation of spectral reflectance (signatures) of various earth surface and near surface materials captured by satellite images. The steps behind this are as follows; collect spectral signatures from remotely sensed images, graph them, and perform analysis on them to verify whether they pass the spectral separability test. The completion of this lab will enable us remote sensing students to collect and properly analyze spectral signature curves for various earth surface and near surface features for any multispectral remotely sensed image.
Methods
The image that will be used for this lab is a Landsat ETM+ image that covers the Eau Claire area and a section of the Cities to collect and analyze spectral signatures of various earth surfaces. I measured and plotted the spectral reflectance of twelve materials and surfaces from the image eau_claire_2000.img. These twelve features are as follows;
- Standing Water
- Moving Water
- Vegetation
- Riparian Vegetation
- Crops
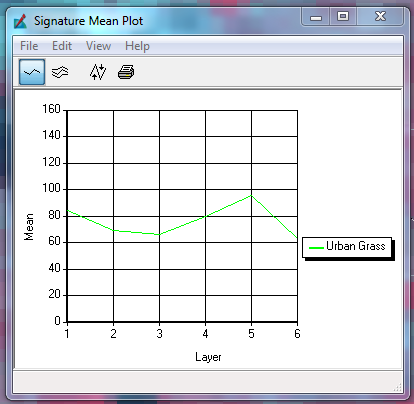
- Urban Grass
- Dry Soil (uncultivated)
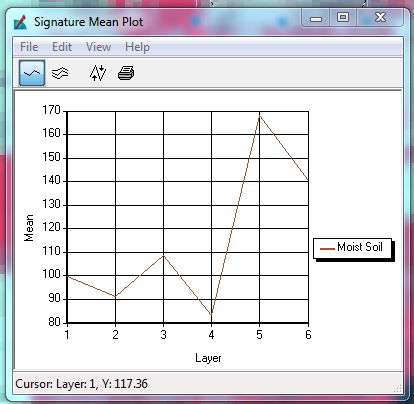
- Moist Soil (uncultivated)
- Rock
- Asphalt Highway
- Airport Runway
- Concrete Surface (Parking Lot)
To begin the lab open up ERDAS and bring in the image eau_claire_2000.img. Zoom into the Eau Claire and Chippewa County area, then locate Lake Wissota. Click Home and then Drawing. Click on the Polygon tool. These steps are shown in the figure below.
 |
| Figure 1: This is a screenshot of the above processes of locating the Polygon tool. Image created by: Cyril Wilson |
Then proceed to digitize Lake Wissota. Next plot the spectral signature that was just collected. Click on Raster, Supervised, and then Signature Editor. After the Signature Editor is open click on Create New Signatures from AOI. This will add the signature with a default value labeled Class 1. Change the name of Class 1 to Standing Water. Then click on Display Mean Plot Window to display the spectral plot of the signature that was just collected from Lake Wissota. This process can be seen below in Figure 2.
 |
| Figure 2: This is a screenshot of the above processes from adding the signature and then displaying the spectral plot of the signature. Image created by: Cyril Wilson |
 |
| Figure 3: This is an example of what the signature plot will look like. This is the signature plat for the feature Standing Water. |
Collect spectral signatures for features 2 through 12 above using the same procedure for standing water. Also change the background of the Signature Mean Plot to white.
Results
Q1: Band 1 (Blue) (0.45 – 0.52 µm) is the band that has the
highest reflectance for standing water. Band 4 (Near IR) (0.76 – 0.90 µm) is
the band that has the lowest reflectance for standing water.
Q2: The highest reflectance was seen with Band 1 (Blue)
because water doesn’t do a good job of absorbing blue from the visible light
spectrum. This blue visible light is then reflected back into the atmosphere,
and this is why water appears blue to us.
The lowest reflectance for water was with the 4th
Band (Near IR). The reason this band has a lower reflectance is because water
is able to effectively absorb the Near IR band. Since a lot of it is absorbed,
there is less to be reflected out into the atmosphere.
Q3:
Sig 2
Sig 3
Sig 4
Highest reflectance = Band 5 (1.55 – 1.75 µm); Lowest
reflectance = Band 3 (0.63 – 0.69 µm)
Sig 5
Highest reflectance = Band 5 (1.55 – 1.75 µm); Lowest
reflectance = Band 2 (0.52 – 0.60 µm)
Sig 6
Highest Reflectance = Band 5 (1.55 – 1.75 µm); Lowest
reflectance = Band 3 (0.63 – 0.69 µm)
Sig 7
Highest Reflectance = Band 5 (1.55 – 1.75 µm); Lowest
reflectance = Band 4 (0.76 – 0.90 µm)
Sig 8
Highest Reflectance = Band 5 (1.55 – 1.75 µm); Lowest
reflectance = Band 4 (0.76 – 0.90 µm)
Sig 9
Highest Reflectance = Band 5 (1.55 – 1.75 µm); Lowest
reflectance = Band 4 (0.76 – 0.90 µm)
Sig 10
Highest Reflectance = Band 5 (1.55 – 1.75 µm); Lowest
reflectance = Band 4 (0.76 – 0.90 µm)
Sig 11
Highest Reflectance = Band 5 (1.55 – 1.75 µm); Lowest
reflectance = Band 4 (0.76 – 0.90 µm)
Sig 12
Highest reflectance = Band 1 (0.45 – 0.52 µm); Lowest
Reflectance = Band 4 (0.76 – 0.90 µm)
Q4:
Vegetation usually shows the highest and lowest reflectance
depending on the state of the vegetation. Vegetation that is healthy and green
will absorb a lot of the energy that it encounters, while vegetation that is
unhealthy and dying will not need that energy and reflect that back into the
atmosphere. Vegetation has the most reflectance at the Band 5 level, which has
a longer wavelength. Newer vegetation will have less protein cells, which in
turn that crop will reflect more because the plant doesn’t need to absorb those
few protein cells. Vegetation has the least amount of reflection between Bands
2 and 3. This is because these bands measure visual light, which is absorbed by
the plants to grow. So in turn these bands are not reflected back into the
atmosphere, but are absorbed.
Q5:
Dry and Wet soils vary the most in the visible light
spectrum, Bands 1-3. Wet soils reflect better than dry soils because of the
water content of the two. Moist soils will have a higher water content, and
since water reflects well, moist soils will reflect more that dry soils.
Q6:
While they do vary, Standing Water and Moving Water do have
a lot of similarities. This is because they are the same substance. The motion
of the water doesn’t change the reflectance enough to make them dissimilar.
Another that is similar is Dry Soil and Rock. This is because they have similar
characteristics and have the same moisture content for the most part, and
similar visual descriptions.
Two features that are very different are Riparian Vegetation
and Moist Soils. Riparian vegetation seems to have way less reflectance than
that of the moist soils. This would be because of the fact that vegetation
absorbs a lot more energy than soil would. The only spectral band that these
two variables are similar in is the 4th Band, otherwise they are
almost polar opposites.
Q7:
The visible light bands, Bands 1-3, seem to have the highest
average reflectance. It doesn’t have either the highest or lowest reflectance.
Which I feel would make it perfect for collecting data from a variety of
different features.


